Think As Historian: THINK AS A HISTORIAN: IDENTIfY AND CONNECT PATTERNS
Line graphs visually represent changes over time. Historians examine graphs and charts to identify patterns or trends. They often compare one pattern or trend with another to see relationships. Critical decisions in history were often based on the graphs that military or other government agencies created.
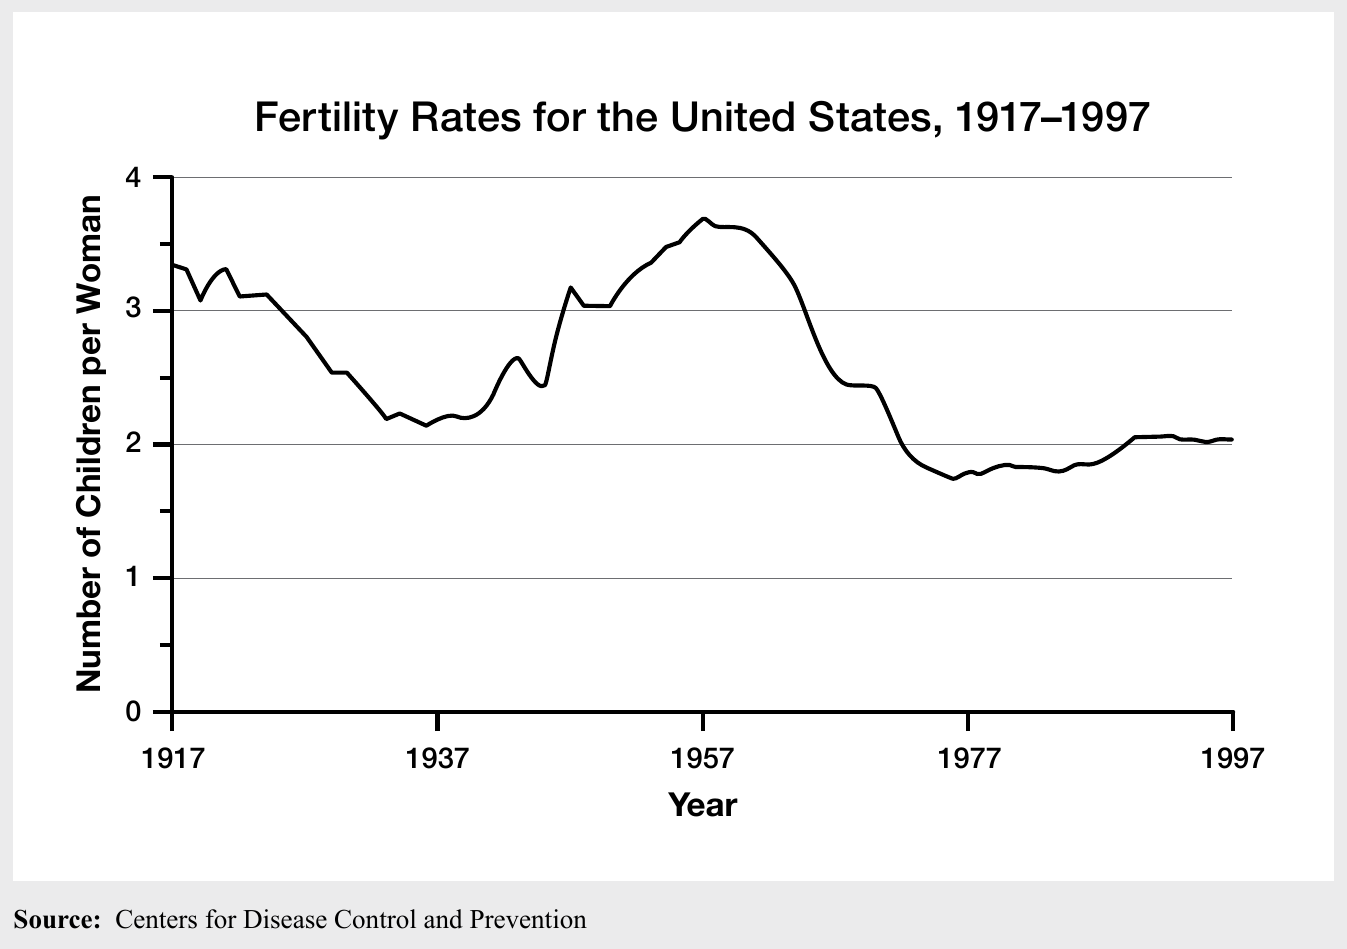
Between 1917 and 1997, the percentage of women in the workforce rose from about 20 percent to 45 percent. Identify and explain the birth rate pattern represented in the graph below. Explain a connection between the information in the graph and women in the workforce.